Laser tag arena ROI in shopping malls: US and EU planning guide
Foot traffic, ticket price, fleet size and rent — how mall laser tag arenas in the US and EU model payback with CYBERTAG kits.
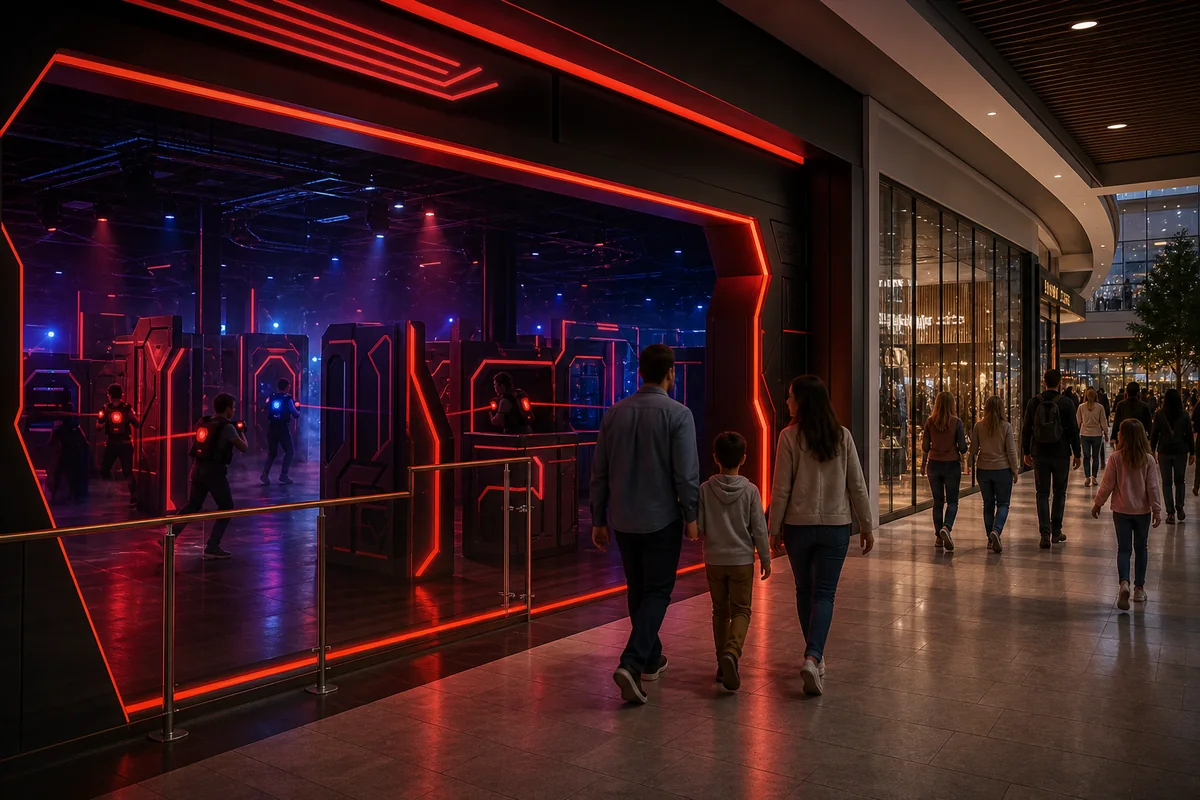
Mall and FEC laser tag arenas live on foot traffic, not search ads. Payback depends on rent as a share of revenue, average ticket, games per hour and a kit sized for Saturday peak — not opening-day minimum.
Revenue drivers in malls
- Walk-in traffic from anchors, cinema and food court.
- Birthday packages — predictable weekday and weekend blocks.
- Corporate and teen groups — higher per-head tickets with scenario packages.
Many successful mall projects run on Smart, Pro or Elite kits with spare sets for peak hours. See real formats on our client map.
Cost structure
Typical mall startup includes CYBERTAG equipment (30–50% of budget), maze build-out, landlord approvals, POS and 2–4 months of working capital. Use the ROI calculator on the Business page for your ticket and occupancy assumptions.
US vs EU differences
US malls: higher ticket potential in major metros; insurance and build-out codes vary by state. EU malls: strong family traffic, EUR invoicing from Latvia, CE documentation supplied with equipment. In both regions, sound insulation and fire approval timelines often exceed equipment lead time — plan early.
Payback benchmark
With stable mall traffic, many operators target 12–24 months payback. Undersized fleets that queue guests on Saturdays extend that window. Size for peak, not average Tuesday.
Share your mall location, area and target capacity — we will help match a kit and rough ROI. Get a consultation.